Python
Python 데이터 분석(주피터노트북) - Seaborn(산점도)
developers developing
2022. 11. 28. 12:00
라이브러리 및 세팅
- import seaborn as sns
- seaborn 폰트 사용 - 한글처리보다 먼저 선언해야함
- sns.set(font_scale=1)
- import pandas as pd
- import matplotlib.pyplot as plt
- 한글처리
- plt.rcParams['font.family'] = 'Malgun Gothic'
- plt.rcParams['axes.unicode_minus'] = False
- 경고 메세지
- import warnings
- warnings.simplefilter("ignore")
- seaborn 스타일의 그래프를 사용
- plt.style.use('seaborn')
아이리스 데이터

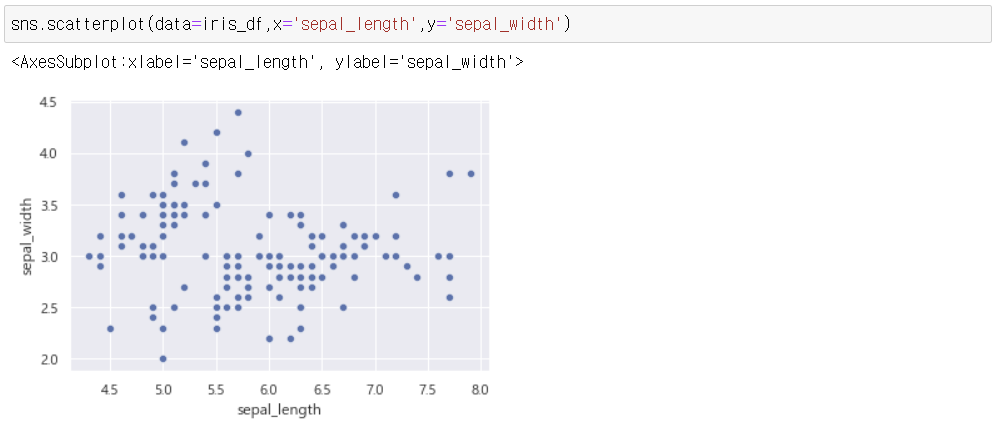
1. scatterplot
- 두개의 값이 관련이 있는지 확인

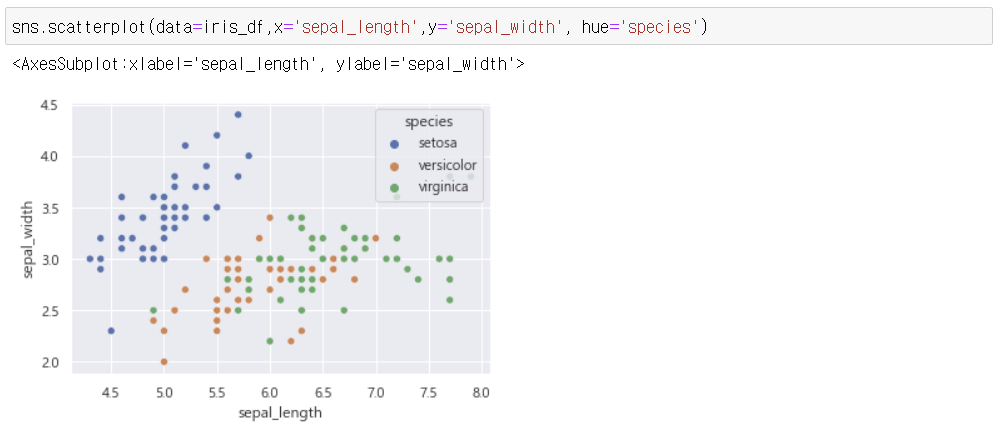
1) hue 값 주기
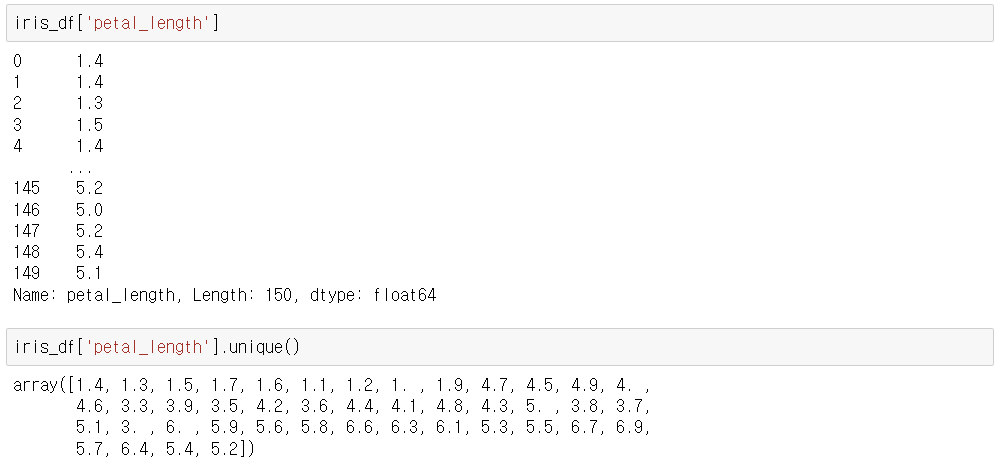
2) petal_length 값을 3미만, 5미만, 5이상으로 분류하여 표시
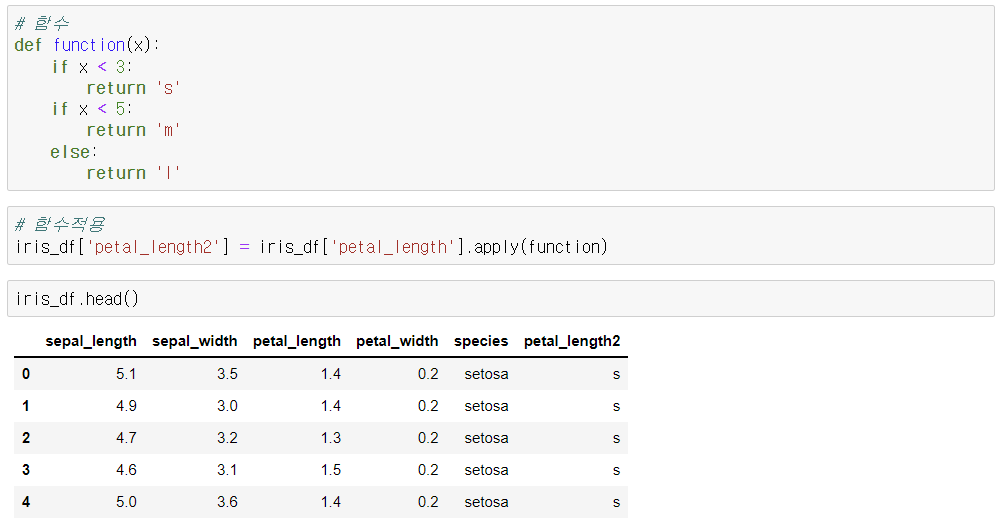
3) petal_length2 컬럼을 생성
- 3미만 == s
- 5미만 == m
- 5이상 == l


4) petal_length3 컬럼 생성(petal_length 값 이용)
- 3미만 == 3
- 5미만 = =5
- 5이상 7으로 분류하여 표시


2. relplot : 컬럼 기준으로 따로 그림

3. lmplot : 산점도 + 회귀곡선
