Python
Python 데이터 분석(주피터노트북) - 지하철 유,무임승차 데이터 분석(티머니)
developers developing
2022. 12. 1. 12:00
데이터 수집
- 대중교통통계자료(https://www.t-money.co.kr/ncs/pct/ugd/ReadTrcrStstList.dev)
- 2022년 6월 자료
라이브러리 및 세팅
- import seaborn as sns
- seaborn 폰트 사용 - 한글처리보다 먼저 선언해야함
- sns.set(font_scale=1)
- import pandas as pd
- import matplotlib.pyplot as plt
- 한글처리
- plt.rcParams['font.family'] = 'Malgun Gothic'
- plt.rcParams['axes.unicode_minus'] = False
- 경고 메세지
- import warnings
- warnings.simplefilter("ignore")
- seaborn 스타일의 그래프를 사용
- plt.style.use('seaborn')

데이터 로드

데이터 탐색
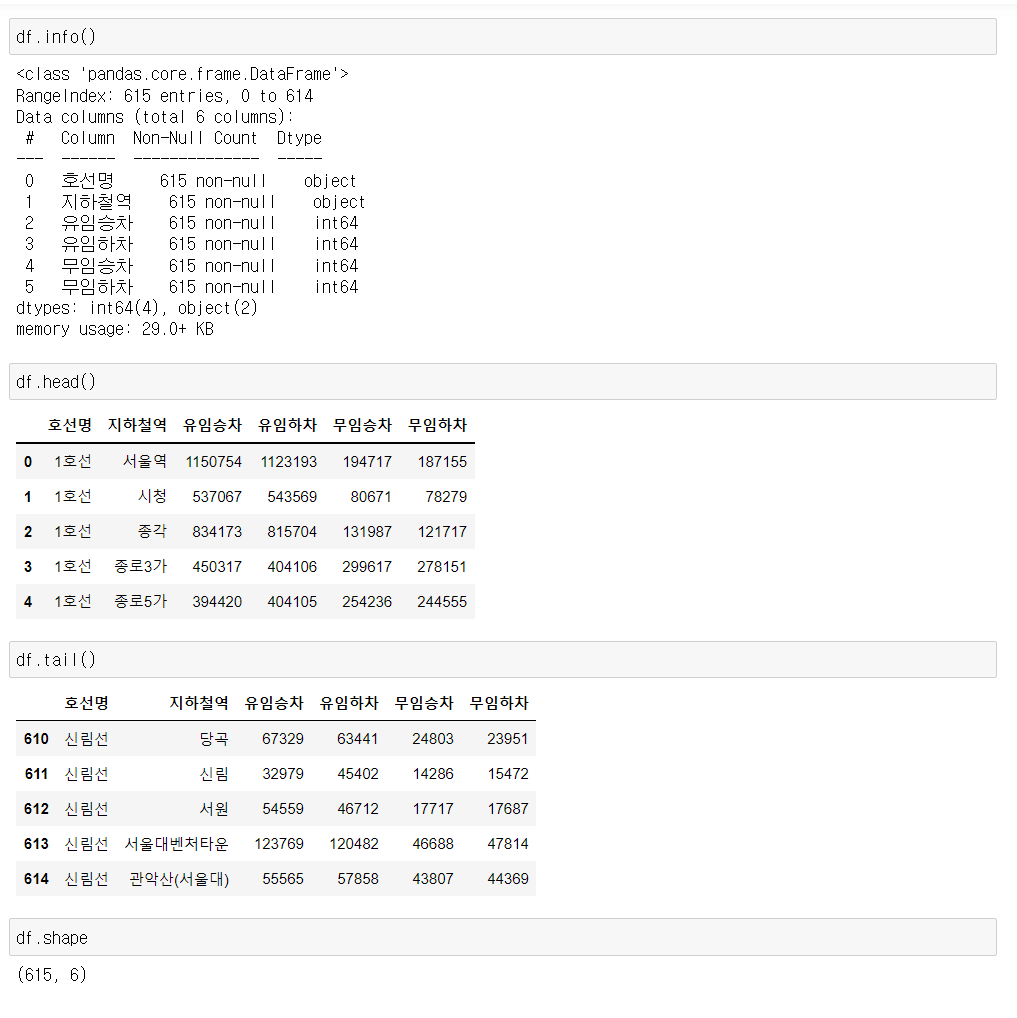
- info
- head
- tail
- shape
EDA
1) 유임승차 비율이 가장 높은 역


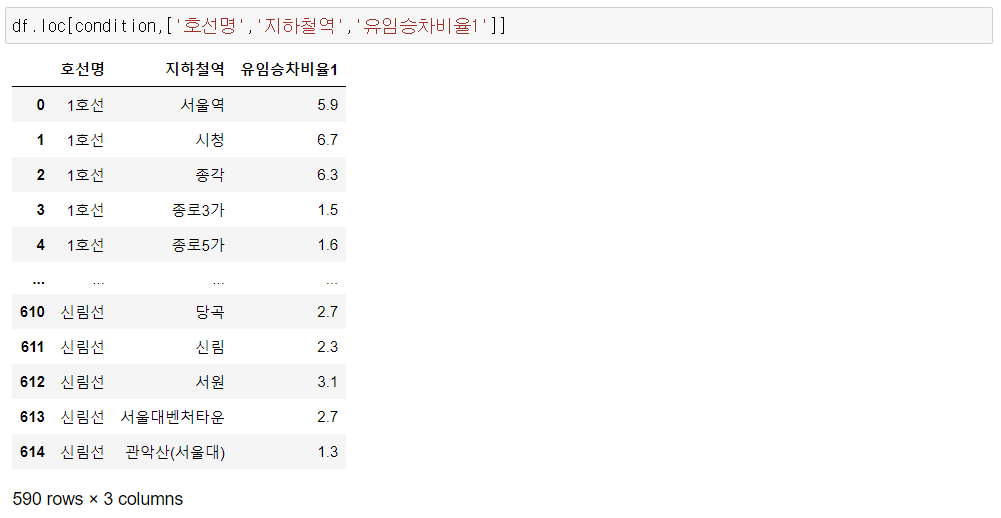
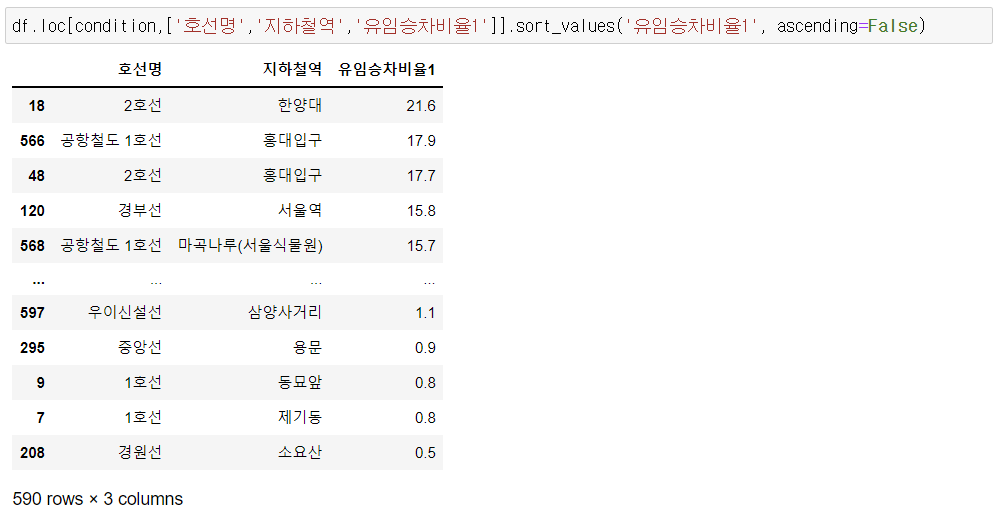
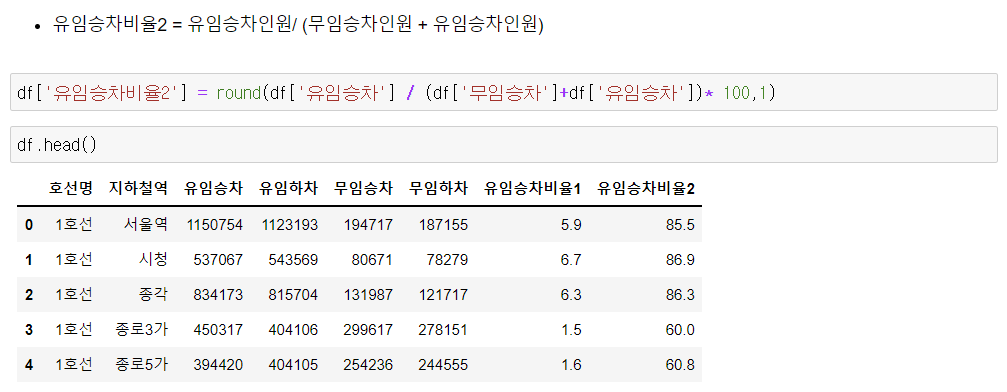
2) 유임승차 비율이 가장 높은 역


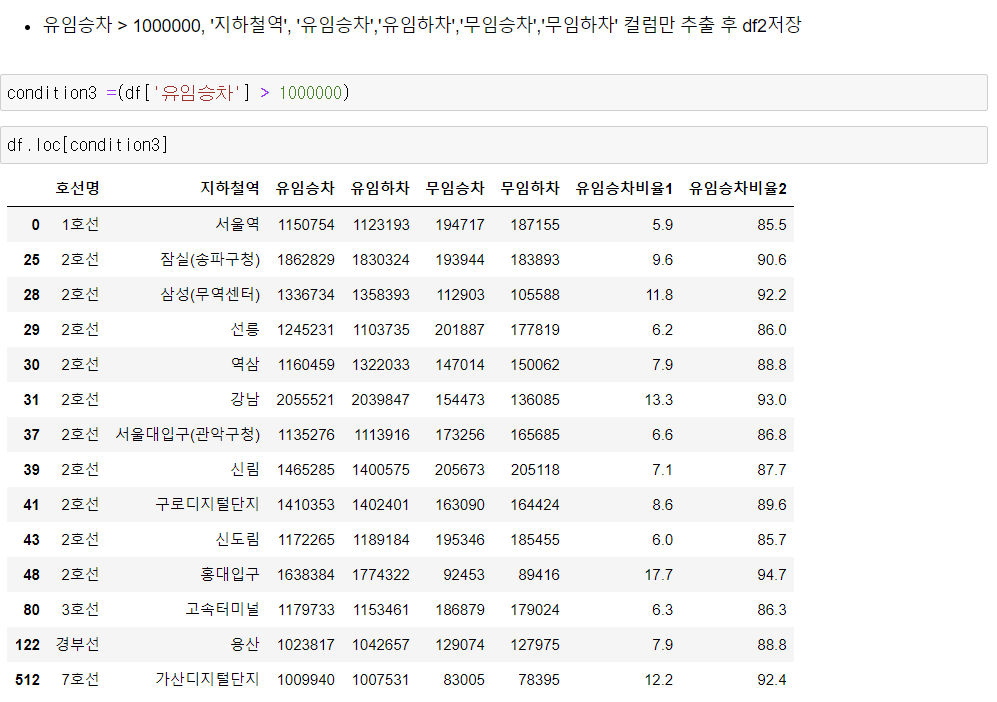
3) 유무임 승하차 인원이 가장 많은 역

시각화
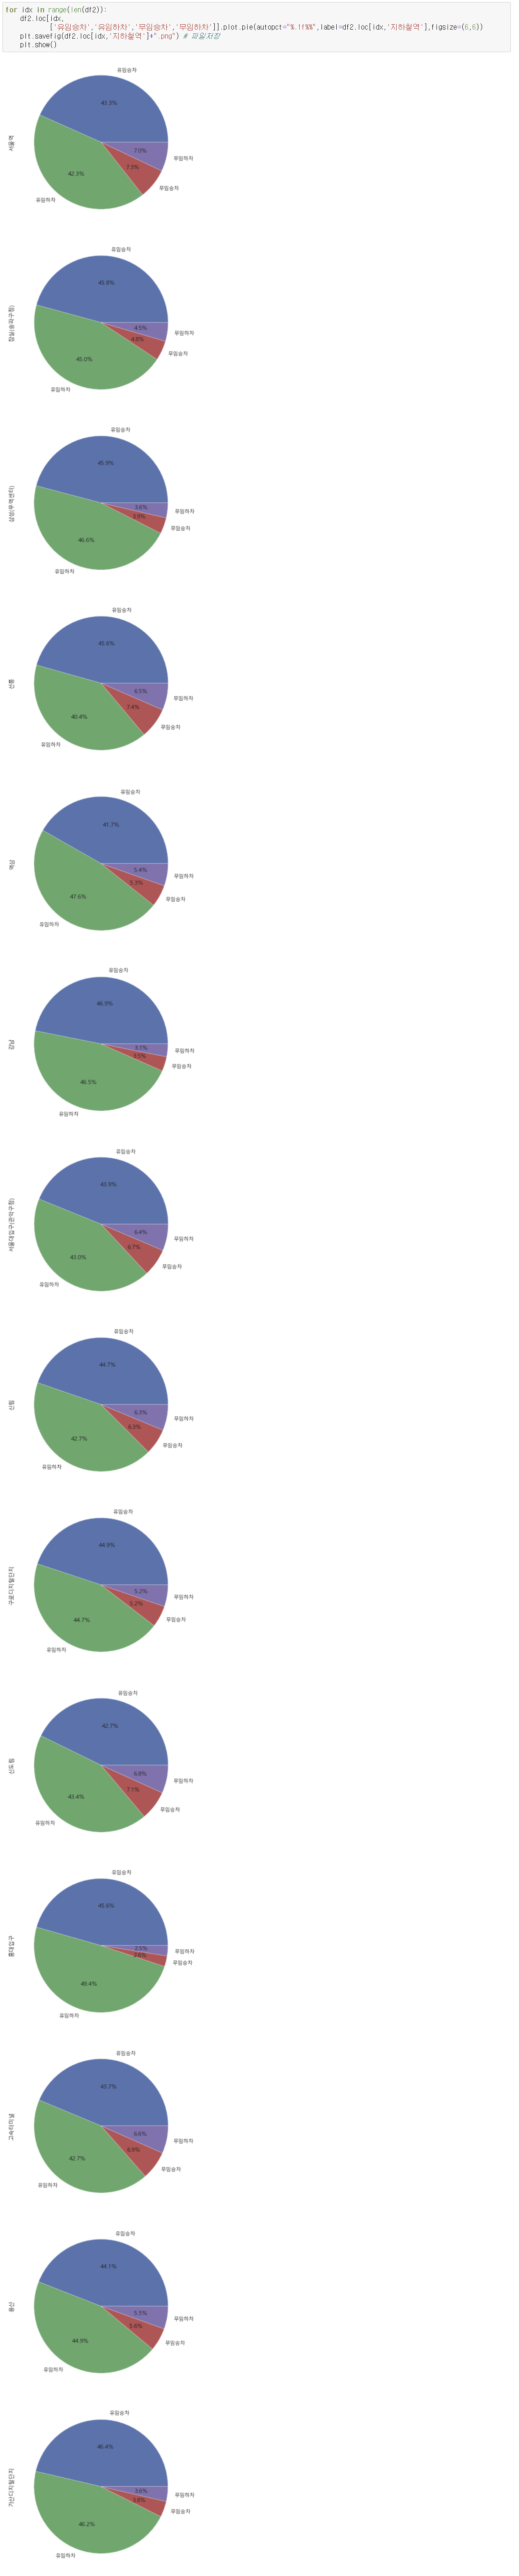
- 유임승차 인원이 1,000,000 이상인 역 추출 후 승하차 비율

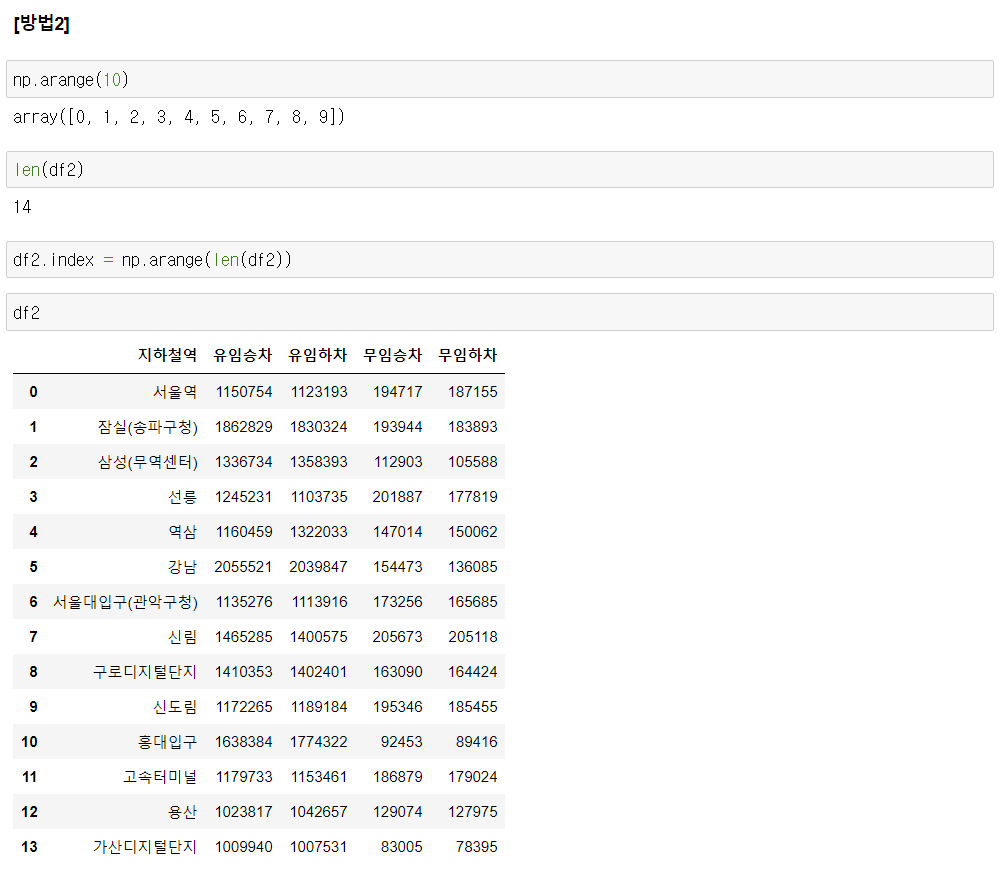
1) 인덱스 재생성

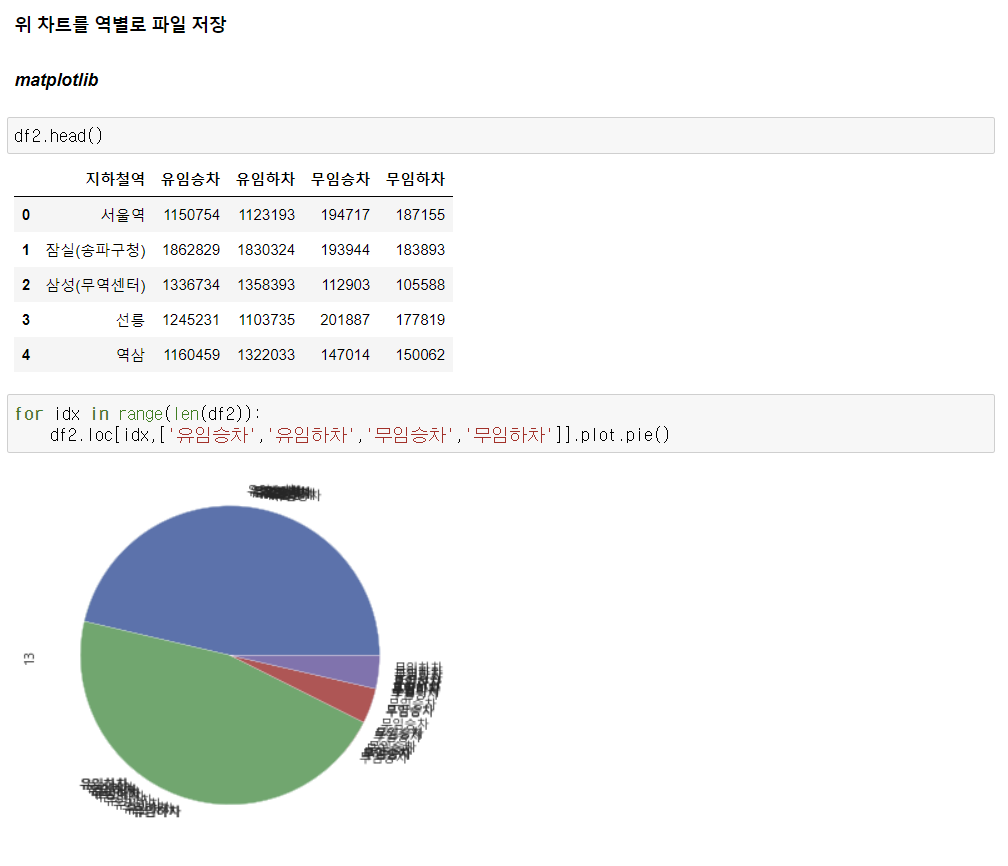
2) pie plot
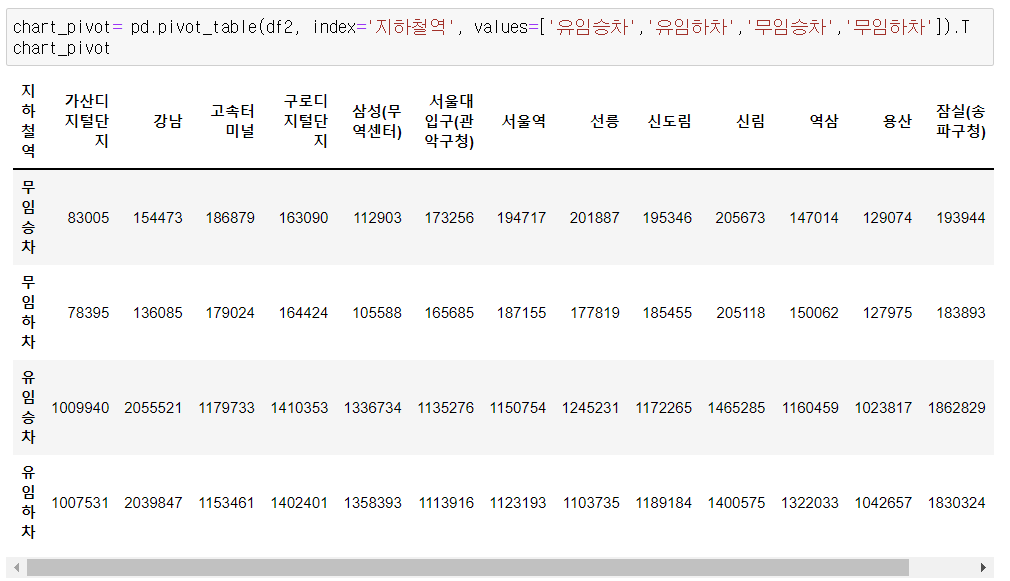
- 데이터 프레임을 차트 그리기 좋은 형태로 변경

- 행렬 변경