
Notice
Recent Posts
Recent Comments
Link
| 일 | 월 | 화 | 수 | 목 | 금 | 토 |
|---|---|---|---|---|---|---|
| 1 | ||||||
| 2 | 3 | 4 | 5 | 6 | 7 | 8 |
| 9 | 10 | 11 | 12 | 13 | 14 | 15 |
| 16 | 17 | 18 | 19 | 20 | 21 | 22 |
| 23 | 24 | 25 | 26 | 27 | 28 | 29 |
| 30 |
Tags
- 맷플롯립
- 주피터노트북그래프
- 파이썬시각화
- 파이썬데이터분석
- 판다스그래프
- SQL
- sql따라하기
- SQL수업
- 주피터노트북맷플롯립
- 수업기록
- 파이썬크롤링
- 파이썬수업
- 파이썬
- 파이썬차트
- 판다스데이터분석
- python데이터분석
- matplotlib
- 주피터노트북판다스
- 파이썬알고리즘
- 주피터노트북
- 팀플기록
- sql연습하기
- 주피터노트북데이터분석
- 파이썬데이터분석주피터노트북
- python수업
- sql연습
- SQLSCOTT
- 데이터분석시각화
- Python
- python알고리즘
Archives
- Today
- Total
IT_developers
Python 데이터 분석(주피터노트북) - Pandas(histogram) 본문
기본 라이브러리
- import pandas as pd
- import matplotlib.pyplot as plt
- import numpy as np
- 한글처리
- plt.rcParams['font.family'] = 'Malgun Gothic'
- plt.rcParams['axes.unicode_minus'] = False
1~100까지 랜덤 50개 숫자 데이터 생성

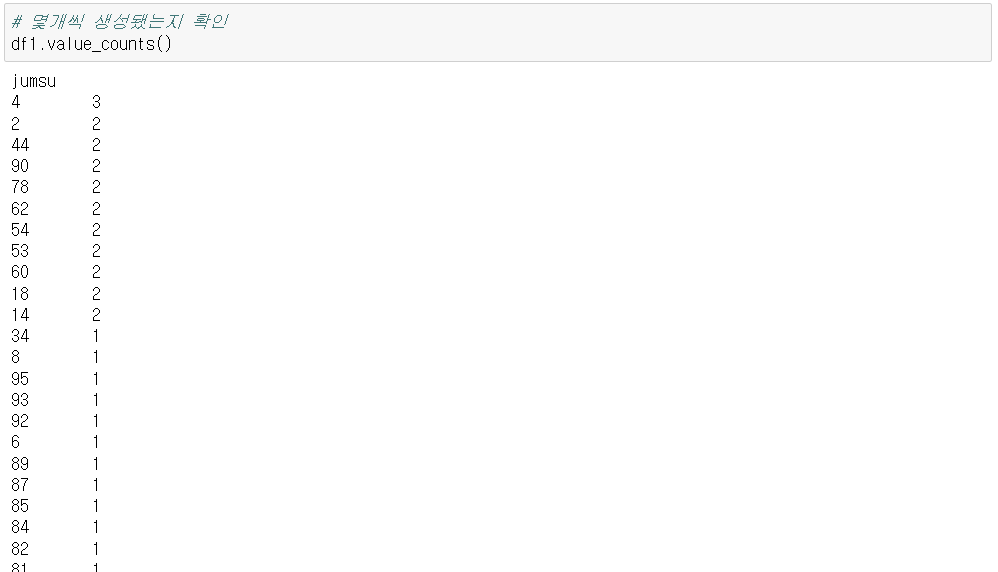
1) 기본 히스토그램
- hist()
- kind='hist'
- 기본 구간 10
- bins : 구간 변경


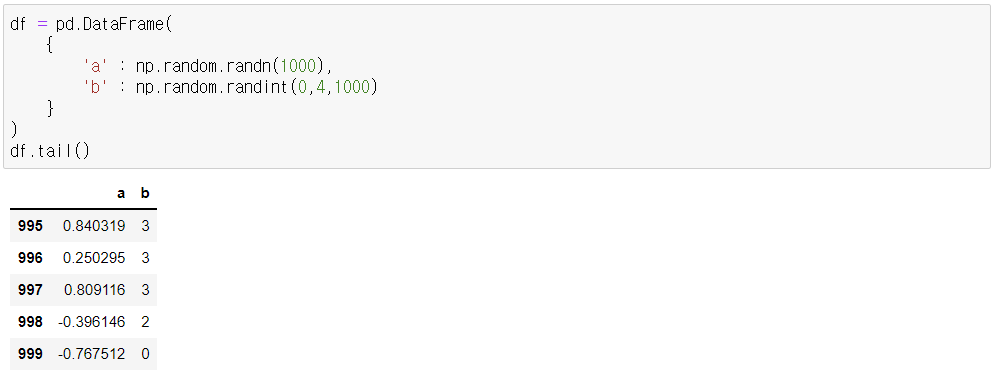
1000개 데이터 생성
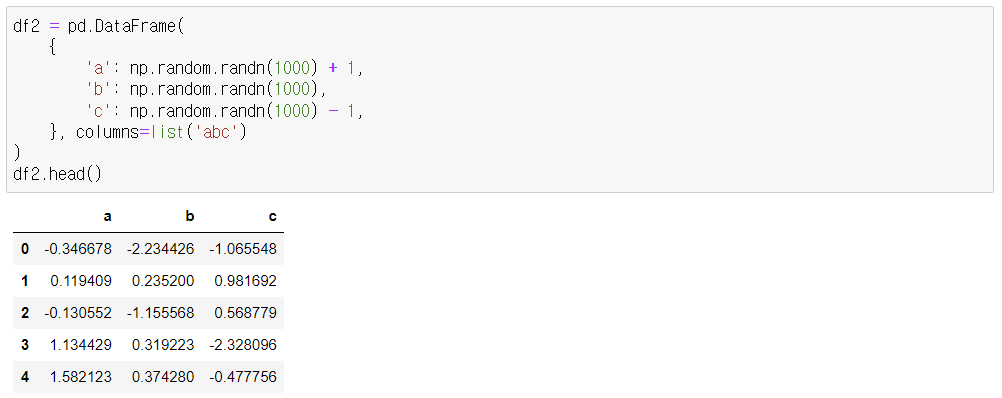
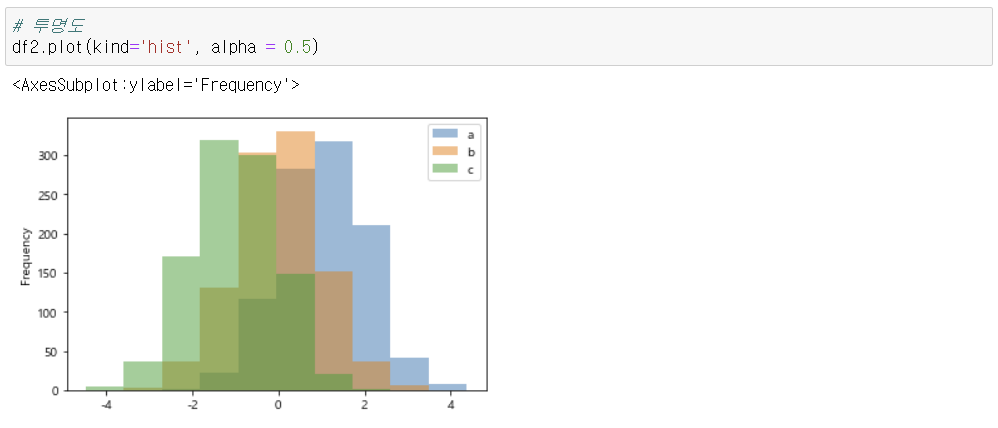
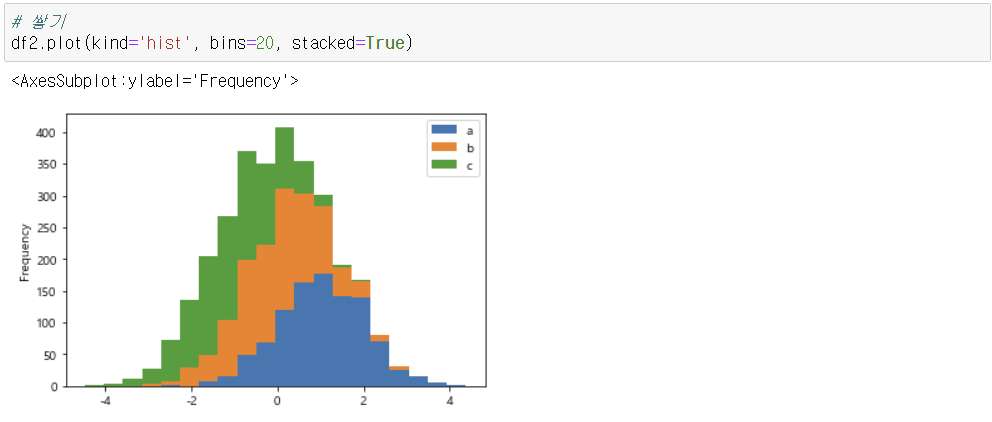
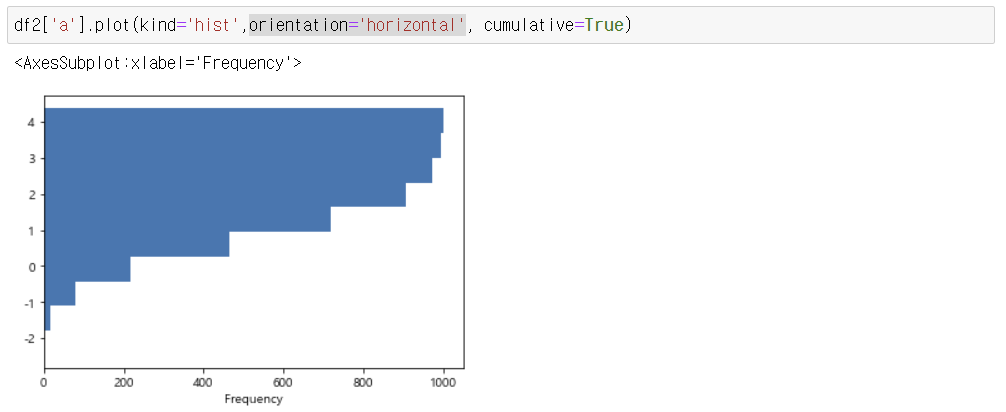
2) 히스토그램 옵션 주기
- alpha : 투명도
- bins : 구간
- stacked : 쌓기
- orientation='horizontal' :옆으로 그리기


데이터 생성
3) 그룹별 히스토그램
- 카테고리가 구현 되어 있을 때 알아서 그려짐.
- plot 주지 않기

'Python' 카테고리의 다른 글
| Python 데이터 분석(주피터노트북) - Pandas(area plot) (0) | 2022.11.24 |
|---|---|
| Python 데이터 분석(주피터노트북) - Pandas(box plot) (0) | 2022.11.24 |
| Python 데이터 분석(주피터노트북) - Pandas(bar plot) (0) | 2022.11.23 |
| Python 데이터 분석(주피터노트북) - Pandas(plot) (0) | 2022.11.23 |
| Python 데이터 분석(주피터노트북) - 유튜브 랭킹 크롤링 및 데이터 분석 (0) | 2022.11.22 |
'Python' Related Articles
more


Comments