
Notice
Recent Posts
Recent Comments
Link
| 일 | 월 | 화 | 수 | 목 | 금 | 토 |
|---|---|---|---|---|---|---|
| 1 | 2 | 3 | 4 | 5 | 6 | |
| 7 | 8 | 9 | 10 | 11 | 12 | 13 |
| 14 | 15 | 16 | 17 | 18 | 19 | 20 |
| 21 | 22 | 23 | 24 | 25 | 26 | 27 |
| 28 | 29 | 30 | 31 |
Tags
- python데이터분석
- 파이썬데이터분석주피터노트북
- 주피터노트북그래프
- 판다스그래프
- 판다스데이터분석
- 파이썬
- 파이썬수업
- 주피터노트북판다스
- 주피터노트북데이터분석
- sql연습하기
- SQL수업
- 파이썬데이터분석
- 파이썬알고리즘
- 데이터분석시각화
- sql연습
- SQL
- 파이썬차트
- 파이썬시각화
- 수업기록
- sql따라하기
- Python
- SQLSCOTT
- 파이썬크롤링
- 주피터노트북맷플롯립
- 주피터노트북
- 팀플기록
- python수업
- 맷플롯립
- python알고리즘
- matplotlib
Archives
- Today
- Total
IT_developers
Python 데이터 분석(주피터노트북) - Seaborn(범주형 시각화) 본문

라이브러리 및 세팅
- import seaborn as sns
- seaborn 폰트 사용 - 한글처리보다 먼저 선언해야함
- sns.set(font_scale=1)
- import pandas as pd
- import matplotlib.pyplot as plt
- 한글처리
- plt.rcParams['font.family'] = 'Malgun Gothic'
- plt.rcParams['axes.unicode_minus'] = False
- 경고 메세지
- import warnings
- warnings.simplefilter("ignore")
- seaborn 스타일의 그래프를 사용
- plt.style.use('seaborn')
데이터 생성
describe() : 수치형 기술 통계 값 확인


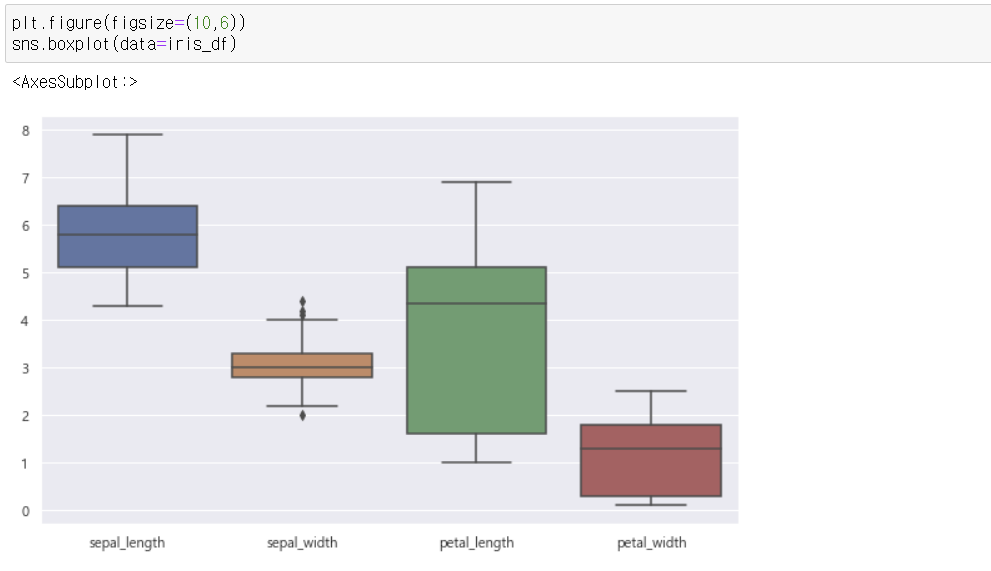
1. boxplot
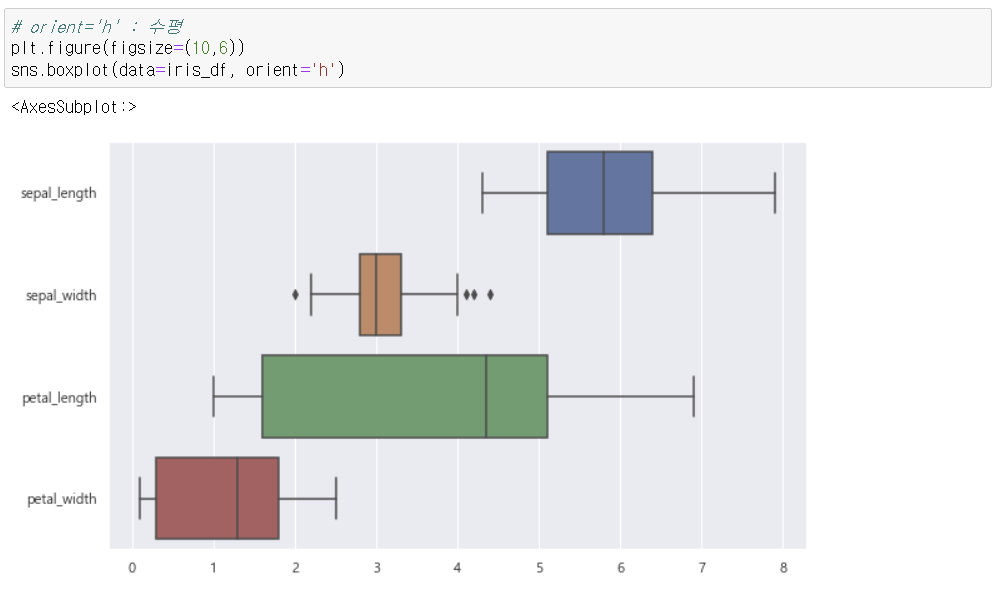
orient = 'h' : 수평
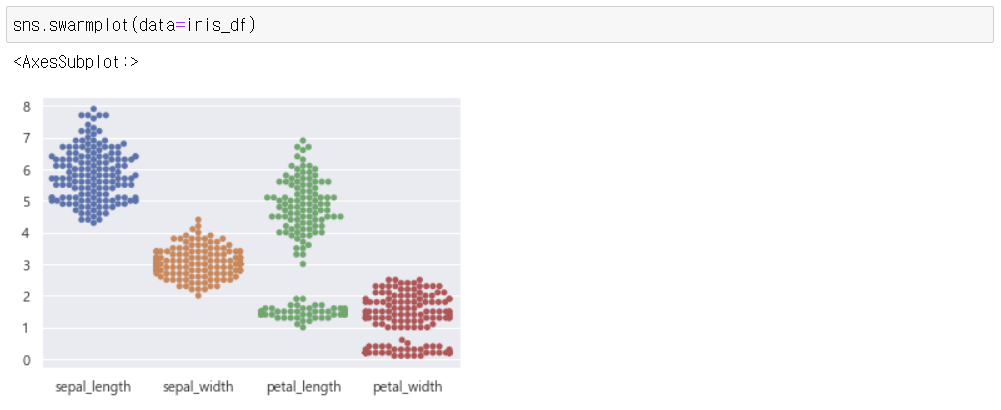
2. swarmplot : 모든 데이터를 점을 찍어 표시
- 찍을 점이 많을 시 경고 메세지가 뜰 수 있음.
- size를 지정

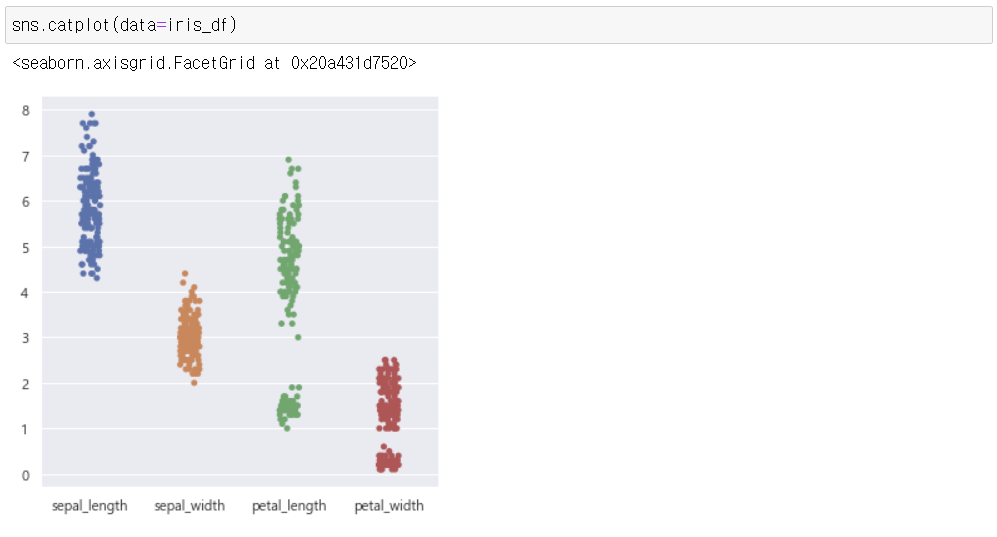
3. catplot
- swarmplot보다 뭉처진 느낌
4. violinplot

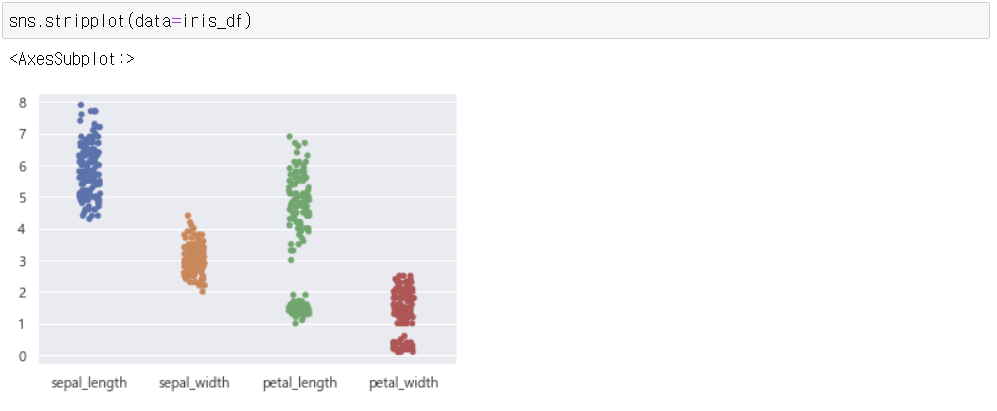
5. stripplot : catplot과 비슷한 모양
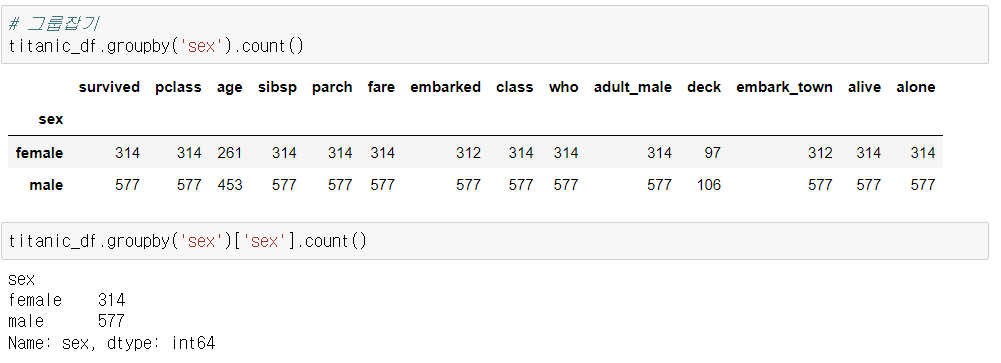
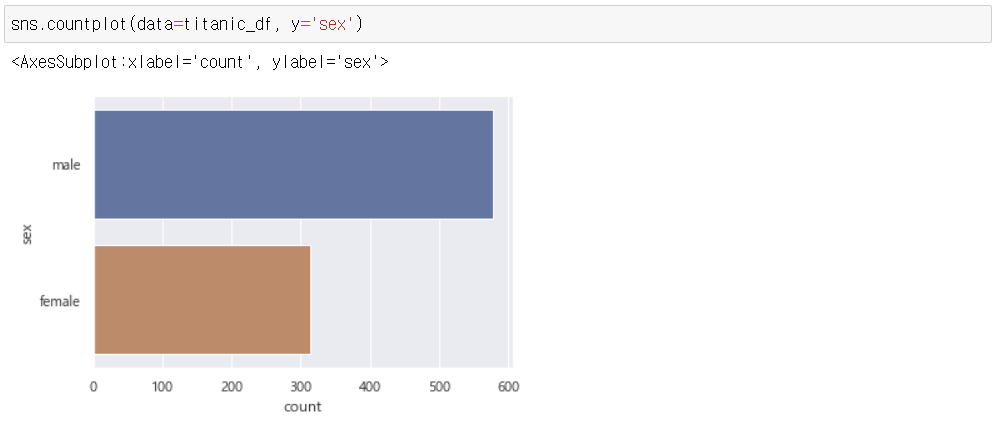
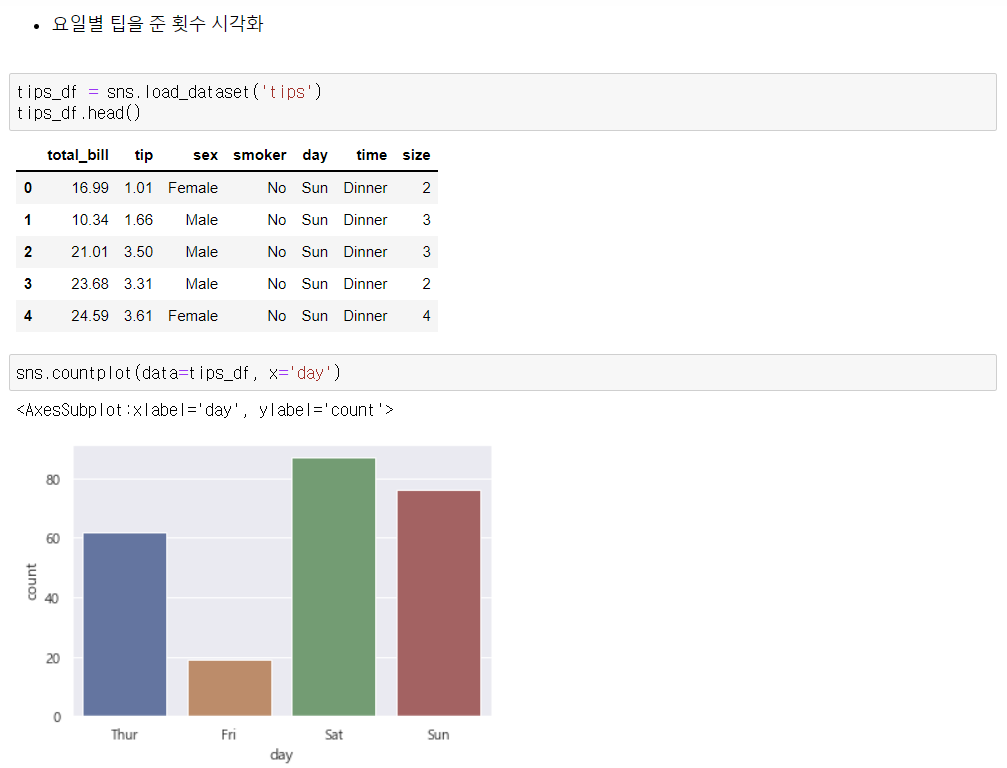
6. countplot
- 타이타닉 데이터
- null 값 확인

1) 성별 차트
- pandas

- seaborn

2) 성별 인원수를 객실 등급별로 시각화
- pandas

- seaborn


'Python' 카테고리의 다른 글
| Python 데이터 분석(주피터노트북) - Seaborn(distribution plots) (0) | 2022.11.27 |
|---|---|
| Python 데이터 분석(주피터노트북) - Seaborn(heatmap) (0) | 2022.11.27 |
| Python 데이터 분석(주피터노트북) - Seaborn(lineplot) (0) | 2022.11.26 |
| Python 데이터 분석(주피터노트북) - Seaborn(barplot) (0) | 2022.11.26 |
| Python 데이터 분석(주피터노트북) - 동네 인구 구조 데이터 분석 (0) | 2022.11.25 |
'Python' Related Articles
more


Comments